Inception Date
01 Jan 2013
NAV
-
Fund Type
Equity Schemes
Risk Level
Very High Risk
Who should invest?
- Investors who are looking to a long term, medium risk strategy to benefit from economic growth of India
- Ideal for first time equity investors who do not have the time or expertise to evaluate individual stocks or track the actively managed funds
- For the experienced investors or HNIs it can act as a balancing strategy for their portfolios. Investing in Nifty50 Index Fund gives them exposure to the leading 50 stocks at one go.
Fund Performance
Return(%) - As on 30th June 2026
| NAV Details (Growth Option) | Regular Plan Growth Option | Scheme Benchmark | Direct Plan Growth Option |
|---|---|---|---|
| 1 Year | (6.49)% | (5.42)% | (6.23)% |
| 3 Year | 7.43% | 8.80% | 7.70% |
| 5 Year | 8.61% | 9.98% | 8.91% |
| Since Inception | 9.88% | Regular : 11.21 | Direct : 12.11% | 11.41% |
Fund’s Portfolio Analysis
As on:
Consumer Non Durables 10.07%
| Asian Paints Ltd. | 2.05% |
| Nestle India Ltd. | 1.01% |
| Tata Consumer Products Ltd. | 0.54% |
| Britannia Industries Ltd. | 0.49% |
| ITC Ltd. | 3.51% |
| Hindustan Unilever Ltd. | 2.47% |
Cement 5.29%
| Grasim Industries Ltd. | 0.76% |
| Shree Cement Ltd. | 0.61% |
| Ultratech Cement Ltd. | 3.92% |
Transportation 1.24%
| Adani Ports and Special Economic Zone Ltd. | 1.24% |
Pesticides 0.92%
| UPL Ltd. | 0.92% |
Banks 22.63%
| HDFC Bank Ltd. | 7.58% |
| ICICI Bank Ltd. | 6.99% |
| State Bank of India | 2.71% |
| Kotak Mahindra Bank Ltd. | 2.59% |
| Axis Bank Ltd. | 1.82% |
| IndusInd Bank Ltd. | 0.94% |
| Yes Bank Ltd. | 0.00% |
Pharmaceuticals 3.9%
| Sun Pharmaceutical Industries Ltd. | 1.28% |
| Cipla Ltd. | 1.18% |
| Dr. Reddy's Laboratories Ltd. | 0.91% |
| Divi's Laboratories Ltd. | 0.53% |
Consumer Durables 0.73%
| Titan Company Ltd. | 0.73% |
Oil 0.54%
| Oil & Natural Gas Corporation Ltd. | 0.54% |
Petroleum Products 9.81%
| Reliance Industries Ltd. | 8.51% |
| Bharat Petroleum Corporation Ltd. | 0.98% |
| Indian Oil Corporation Ltd. | 0.32% |
Minerals/Mining 0.31%
| Coal India Ltd. | 0.31% |
Construction Project 3.42%
| Larsen & Toubro Ltd. | 3.42% |
Finance 8.56%
| Housing Development Finance Corporation Ltd. | 5.93% |
| Bajaj Finance Ltd. | 2.63% |
Ferrous Metals 2.96%
| Tata Steel Ltd. | 2.09% |
| JSW Steel Ltd. | 0.87% |
Software 15.77%
| Infosys Ltd. | 7.33% |
| Tata Consultancy Services Ltd. | 4.19% |
| Wipro Ltd. | 2.03% |
| HCL Technologies Ltd. | 1.54% |
| Tech Mahindra Ltd. | 0.68% |
Auto 6.87%
| Bajaj Auto Ltd. | 1.59% |
| Maruti Suzuki India Ltd. | 1.50% |
| Tata Motors Ltd. | 1.21% |
| Mahindra & Mahindra Ltd. | 1.16% |
| Eicher Motors Ltd. | 0.72% |
| Hero MotoCorp Ltd. | 0.69% |
Insurance 2.08%
| Bajaj Finserv Ltd. | 0.81% |
| HDFC Life Insurance Company Ltd. | 0.66% |
| SBI Life Insurance Company Ltd. | 0.61% |
Telecom Services 1.89%
| Bharti Airtel Ltd. | 1.89% |
Non - Ferrous Metals 1.57%
| Hindalco Industries Ltd. | 1.57% |
Power 1.45%
| Power Grid Corporation of India Ltd. | 0.78% |
| NTPC Ltd. | 0.67% |
Fund Manager

Mr. Anuj Kapil
Fund Manager-Equity Scheme
Profile
He has overall experience of 19 years in Managing wealth management and handling Risk Management Process for various Corporates, He worked with Religare Securities Ltd as AVP- Risk & Opreations, FCH Centrum Wealth Managers Ltd. as Manager-Risk and in Priviwealth Pvt Ltd. as Head of Research.
Fund Manager

Mr. Anuj Kapil
Profile
He has overall experience of 19 years in Managing wealth management and handling Risk Management Process for various Corporates, He worked with Religare Securities Ltd as AVP- Risk & Opreations, FCH Centrum Wealth Managers Ltd. as Manager-Risk and in Priviwealth Pvt Ltd. as Head of Research.
Riskometer
Riskometer Scheme#
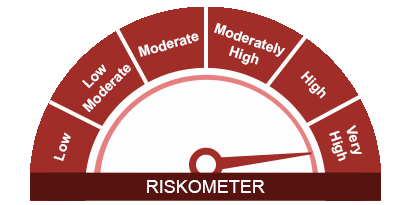
The risk of the scheme is very high risk
Riskometer Scheme Indices
Risk-O-Meter - Nifty 50 TRI
*Investors should consult their financial advisers if in doubt about whether the product is suitable for them.
#Source: ICRA
Fund Details
Nature
The net assets of the Scheme will be invested predominantly in stocks constituting the Nifty 50 and / or in exchange traded derivatives on the Nifty 50. This would be done by investing in almost all the stocks comprising the Nifty 50.
Entry load
Nil
Exit Load
1% if exited on or before 365 days, NIL after 365 days (w.e.f. 2nd September 2024)
Minimum Application Amount
Rs.500/- & multiple of Rs.1/- thereafter
Investment Objective
The investment objective of the scheme is to replicate the Nifty 50 by investing in securities of the Nifty 50 Index in the same proportion/ weightage.
Date of Allotment
June 19, 2010
Benchmark
Nifty 50 TRI. Benchmark Index renamed w.e.f. 01/02/2018
Asset Allocation
Securities Covered by Nifty: 95-100%
Debt, Cash & Money Market Instruments: 0-5%
Monthly AUM
Monthly Average AUM: Rs. 6.40 Cr.
Month End AUM: Rs. 6.29 Cr
Liquidity
Sale & repurchase on all business days.
Net Asset Value (NAV)
Face Value Rs 10/-.
Regular Plan: Rs. 28.47 (IDCW), Rs. 44.65 (G) per unit.
Direct Plan: Rs. 44.61 (IDCW), Rs. 47.67 (G) per unit.
NAV Calculation: All Business days.
Base Expense Ratio
Regular Plan : 0.90%
Direct Plan : 0.66%
Quantitative Data
Regular Plan :
Sharpe Ratio: 0.24
Standard Deviation: 13.67%
Beta: 0.99
Portfolio Turnover: 0.14
Tracking Error : 0.11
Fund Download File
 One Pager
Nature
The net assets of the Scheme will be invested predominantly in stocks constituting the Nifty 50 and / or in exchange traded derivatives on the Nifty 50. This would be done by investing in almost all the stocks comprising the Nifty 50.
Entry load
Nil
Exit Load
1% if exited on or before 365 days, NIL after 365 days (w.e.f. 2nd September 2024)
Minimum Application Amount
Rs.500/- & multiple of Rs.1/- thereafter
Investment Objective
The investment objective of the scheme is to replicate the Nifty 50 by investing in securities of the Nifty 50 Index in the same proportion/ weightage.
Date of Allotment
June 19, 2010
Benchmark
Nifty 50 TRI. Benchmark Index renamed w.e.f. 01/02/2018
Asset Allocation
Securities Covered by Nifty: 95-100%
Debt, Cash & Money Market Instruments: 0-5%
Monthly AUM
Monthly Average AUM: Rs. 6.40 Cr.
Month End AUM: Rs. 6.29 Cr
Liquidity
Sale & repurchase on all business days.
Net Asset Value (NAV)
Face Value Rs 10/-.
Regular Plan: Rs. 28.47 (IDCW), Rs. 44.65 (G) per unit.
Direct Plan: Rs. 44.61 (IDCW), Rs. 47.67 (G) per unit.
NAV Calculation: All Business days.
Base Expense Ratio
Regular Plan : 0.90%
Direct Plan : 0.66%
Quantitative Data
Regular Plan :
Sharpe Ratio: 0.24
Standard Deviation: 13.67%
Beta: 0.99
Portfolio Turnover: 0.14
Tracking Error : 0.11
Fund Download File
Inception Date
10 Jun 2010
NAV
-
Fund Type
Equity Schemes
Risk Level
Very High Risk
Who should invest?
- Investors who are looking to a long term, medium risk strategy to benefit from economic growth of India
- Ideal for first time equity investors who do not have the time or expertise to evaluate individual stocks or track the actively managed funds
- For the experienced investors or HNIs it can act as a balancing strategy for their portfolios. Investing in Nifty50 Index Fund gives them exposure to the leading 50 stocks at one go.
Fund Performance
Return(%) - As on 30th June 2026
| NAV Details (Growth Option) | Regular Plan Growth Option | Scheme Benchmark | Direct Plan Growth Option |
|---|---|---|---|
| 1 Year | (6.49)% | (5.42)% | (6.23)% |
| 3 Year | 7.43% | 8.80% | 7.70% |
| 5 Year | 8.61% | 9.98% | 8.91% |
| Since Inception | 9.88% | Regular : 11.21 | Direct : 12.11% | 11.41% |
Fund’s Portfolio Analysis
As on:
Banks 22.63%
| HDFC Bank Ltd. | 7.58% |
| ICICI Bank Ltd. | 6.99% |
| State Bank of India | 2.71% |
| Kotak Mahindra Bank Ltd. | 2.59% |
| Axis Bank Ltd. | 1.82% |
| IndusInd Bank Ltd. | 0.94% |
| Yes Bank Ltd. | 0.00% |
Software 15.77%
| Infosys Ltd. | 7.33% |
| Tata Consultancy Services Ltd. | 4.19% |
| Wipro Ltd. | 2.03% |
| HCL Technologies Ltd. | 1.54% |
| Tech Mahindra Ltd. | 0.68% |
Consumer Non Durables 10.07%
| ITC Ltd. | 3.51% |
| Hindustan Unilever Ltd. | 2.47% |
| Asian Paints Ltd. | 2.05% |
| Nestle India Ltd. | 1.01% |
| Tata Consumer Products Ltd. | 0.54% |
| Britannia Industries Ltd. | 0.49% |
Petroleum Products 9.81%
| Reliance Industries Ltd. | 8.51% |
| Bharat Petroleum Corporation Ltd. | 0.98% |
| Indian Oil Corporation Ltd. | 0.32% |
Finance 8.56%
| Housing Development Finance Corporation Ltd. | 5.93% |
| Bajaj Finance Ltd. | 2.63% |
Auto 8.13%
| Bajaj Auto Ltd. | 1.59% |
| Maruti Suzuki India Ltd. | 1.50% |
| Tata Motors Ltd. | 1.21% |
| Tata Motors Ltd. | 1.26% |
| Mahindra & Mahindra Ltd. | 1.16% |
| Eicher Motors Ltd. | 0.72% |
| Hero MotoCorp Ltd. | 0.69% |
Cement 5.29%
| Ultratech Cement Ltd. | 3.92% |
| Grasim Industries Ltd. | 0.76% |
| Shree Cement Ltd. | 0.61% |
Pharmaceuticals 3.9%
| Sun Pharmaceutical Industries Ltd. | 1.28% |
| Cipla Ltd. | 1.18% |
| Dr. Reddy's Laboratories Ltd. | 0.91% |
| Divi's Laboratories Ltd. | 0.53% |
Construction Project 3.42%
| Larsen & Toubro Ltd. | 3.42% |
Ferrous Metals 2.96%
| Tata Steel Ltd. | 2.09% |
| JSW Steel Ltd. | 0.87% |
Insurance 2.08%
| Bajaj Finserv Ltd. | 0.81% |
| HDFC Life Insurance Company Ltd. | 0.66% |
| SBI Life Insurance Company Ltd. | 0.61% |
Telecom Services 1.89%
| Bharti Airtel Ltd. | 1.89% |
Non - Ferrous Metals 1.57%
| Hindalco Industries Ltd. | 1.57% |
Power 1.45%
| Power Grid Corporation of India Ltd. | 0.78% |
| NTPC Ltd. | 0.67% |
Transportation 1.24%
| Adani Ports and Special Economic Zone Ltd. | 1.24% |
Pesticides 0.92%
| UPL Ltd. | 0.92% |
Consumer Durables 0.73%
| Titan Company Ltd. | 0.73% |
Oil 0.54%
| Oil & Natural Gas Corporation Ltd. | 0.54% |
Minerals/Mining 0.31%
| Coal India Ltd. | 0.31% |
Fund Manager
Mr. Anuj Kapil
Fund Manager-Equity Scheme
Profile
He has overall experience of 19 years in Managing wealth management and handling Risk Management Process for various Corporates, He worked with Religare Securities Ltd as AVP- Risk & Opreations, FCH Centrum Wealth Managers Ltd. as Manager-Risk and in Priviwealth Pvt Ltd. as Head of Research.
Fund Manager
Mr. Anuj Kapil
Profile
He has overall experience of 19 years in Managing wealth management and handling Risk Management Process for various Corporates, He worked with Religare Securities Ltd as AVP- Risk & Opreations, FCH Centrum Wealth Managers Ltd. as Manager-Risk and in Priviwealth Pvt Ltd. as Head of Research.
Riskometer
Riskometer Scheme#
The risk of the scheme is very high risk
Riskometer Scheme Indices
Risk-O-Meter - Nifty 50 TRI
*Investors should consult their financial advisers if in doubt about whether the product is suitable for them.
#Source: ICRA
Fund Details
Nature
The net assets of the Scheme will be invested predominantly in stocks constituting the Nifty 50 and / or in exchange traded derivatives on the Nifty 50. This would be done by investing in almost all the stocks comprising the Nifty 50.
Entry load
Nil
Exit Load
1% if exited on or before 365 days, NIL after 365 days (w.e.f. 2nd September 2024)
Minimum Application Amount
Rs.500/- & multiple of Rs.1/- thereafter
Investment Objective
The investment objective of the scheme is to replicate the Nifty 50 by investing in securities of the Nifty 50 Index in the same proportion/ weightage.
Date of Allotment
June 19, 2010
Benchmark
Nifty 50 TRI. Benchmark Index renamed w.e.f. 01/02/2018
Asset Allocation
Securities Covered by Nifty: 95-100%
Debt, Cash & Money Market Instruments: 0-5%
Monthly AUM
Monthly Average AUM: Rs. 6.40 Cr.
Month End AUM: Rs. 6.29 Cr
Liquidity
Sale & repurchase on all business days.
Net Asset Value (NAV)
Face Value Rs 10/-.
Regular Plan: Rs. 28.47 (IDCW), Rs. 44.65 (G) per unit.
Direct Plan: Rs. 44.61 (IDCW), Rs. 47.67 (G) per unit.
NAV Calculation: All Business days.
Base Expense Ratio
Regular Plan : 0.90%
Direct Plan : 0.66%
Quantitative Data
Regular Plan :
Sharpe Ratio: 0.24
Standard Deviation: 13.67%
Beta: 0.99
Portfolio Turnover: 0.14
Tracking Error : 0.11
Fund Download File
Nature
The net assets of the Scheme will be invested predominantly in stocks constituting the Nifty 50 and / or in exchange traded derivatives on the Nifty 50. This would be done by investing in almost all the stocks comprising the Nifty 50.
Entry load
Nil
Exit Load
1% if exited on or before 365 days, NIL after 365 days (w.e.f. 2nd September 2024)
Minimum Application Amount
Rs.500/- & multiple of Rs.1/- thereafter
Investment Objective
The investment objective of the scheme is to replicate the Nifty 50 by investing in securities of the Nifty 50 Index in the same proportion/ weightage.
Date of Allotment
June 19, 2010
Benchmark
Nifty 50 TRI. Benchmark Index renamed w.e.f. 01/02/2018
Asset Allocation
Securities Covered by Nifty: 95-100%
Debt, Cash & Money Market Instruments: 0-5%
Monthly AUM
Monthly Average AUM: Rs. 6.40 Cr.
Month End AUM: Rs. 6.29 Cr
Liquidity
Sale & repurchase on all business days.
Net Asset Value (NAV)
Face Value Rs 10/-.
Regular Plan: Rs. 28.47 (IDCW), Rs. 44.65 (G) per unit.
Direct Plan: Rs. 44.61 (IDCW), Rs. 47.67 (G) per unit.
NAV Calculation: All Business days.
Base Expense Ratio
Regular Plan : 0.90%
Direct Plan : 0.66%
Quantitative Data
Regular Plan :
Sharpe Ratio: 0.24
Standard Deviation: 13.67%
Beta: 0.99
Portfolio Turnover: 0.14
Tracking Error : 0.11