Inception Date
01 Jan 2013
NAV
-
Fund Type
Equity Schemes
Risk Level
Very High Risk
Who should invest?
- Investors looking for suitable investment opportunities that comply with Shariah norms should look to invest in the Taurus Ethical fund with a Medium to Long term investment horizon. It is a socially responsible form of investing.
- BSE 500 Shariah Index will be used as the benchmark for comparing the performance of this Scheme.
Fund Performance
Return(%) - As on 30th June 2026
| NAV Details (Growth Option) | Regular Plan Growth Option | Scheme Benchmark | Direct Plan Growth Option |
|---|---|---|---|
| 1 Year | (5.20)% | (2.34)% | (3.81)% |
| 3 Year | 11.34% | 10.47% | 12.81% |
| 5 Year | 9.19% | 8.62% | 10.54% |
| Since Inception | 15.66% | Regular : 15.21 | Direct : 14.33% | 14.11% |
Fund’s Portfolio Analysis
As on:
Consumer Durables 10%
| Cera Sanitaryware Ltd. | 1.77% |
| Bata India Ltd. | 1.53% |
| Relaxo Footwears Ltd. | 1.40% |
| Blue Star Ltd. | 1.82% |
| Havells India Ltd. | 0.97% |
| Voltas Ltd. | 2.51% |
Pharmaceuticals 7.32%
| Divi's Laboratories Ltd | 1.27% |
| Cipla Ltd. | 0.86% |
| Aurobindo Pharma Ltd. | 0.87% |
| Cadila Healthcare Ltd. | 0.75% |
| Granules India Ltd. | 0.42% |
| Sun Pharmaceutical Industries Ltd. | 1.85% |
| Alkem Laboratories Ltd. | 1.30% |
Auto 4.61%
| Eicher Motors Ltd. | 0.91% |
| Hero MotoCorp Ltd. | 0.54% |
| Maruti Suzuki India Ltd. | 2.01% |
| Bajaj Auto Ltd. | 1.15% |
Transportation 0.92%
| VRL Logistics Ltd. | 0.92% |
Healthcare Services 0.49%
| Apollo Hospitals Enterprise Ltd. | 0.49% |
Software 18.42%
| Infosys Ltd. | 5.94% |
| Coforge Ltd. | 0.51% |
| Tata Consultancy Services Ltd. | 4.90% |
| Tech Mahindra Ltd. | 0.19% |
| MindTree Ltd. | 1.94% |
| Tata Elxsi Ltd. | 1.64% |
| Cyient Ltd. | 1.23% |
| Oracle Financial Services Software Ltd. | 0.81% |
| Larsen & Toubro Infotech Ltd. | 0.66% |
| HCL Technologies Ltd. | 0.60% |
Pesticides 5.01%
| Sumitomo Chemical India Ltd. | 2.22% |
| Dhanuka Agritech Ltd. | 1.67% |
| PI Industries Ltd. | 1.12% |
Industrial Products 8.19%
| Cummins India Ltd. | 1.84% |
| Supreme Industries Ltd. | 1.11% |
| SKF India Ltd. | 0.91% |
| Astral Limited | 1.09% |
| Grindwell Norton Ltd. | 0.55% |
| RHI MAGNESITA INDIA | 1.03% |
| AIA Engineering Ltd. | 0.84% |
| HEG Ltd. | 0.82% |
| Carborundum Universal Ltd. | 0.00% |
Consumer Non Durables 7.37%
| Tata Consumer Products Ltd. | 2.01% |
| Berger Paints India Ltd. | 1.90% |
| Dabur India Ltd. | 1.53% |
| Hindustan Unilever Ltd. | 1.05% |
| Colgate Palmolive (India) Ltd. | 0.88% |
Auto Ancillaries 3.02%
| Bosch Ltd. | 1.81% |
| MRF Ltd. | 1.21% |
Gas 2.57%
| Gujarat Gas Ltd. | 1.17% |
| Petronet LNG Ltd. | 0.79% |
| GAIL (India) Ltd. | 0.61% |
Cement 10.09%
| Shree Cement Ltd. | 2.93% |
| The Ramco Cements Ltd. | 2.49% |
| Ultratech Cement Ltd. | 2.23% |
| HeidelbergCement India Ltd | 1.52% |
| ACC Ltd. | 0.92% |
Chemicals 5.89%
| Atul Ltd. | 1.95% |
| Pidilite Industries Ltd. | 1.39% |
| Solar Industries India Ltd. | 1.42% |
| Galaxy Surfactants Ltd. | 1.13% |
Fertilisers 1.98%
| Coromandel International Ltd. | 1.98% |
Ferrous Metals 1.72%
| Ratnamani Metals & Tubes Ltd. | 1.72% |
Industrial Capital Goods 1.97%
| Thermax Ltd. | 1.97% |
Minerals/Mining 1.55%
| NMDC Ltd. | 1.55% |
Capital Markets 1.32%
| Indian Energy Exchange Ltd. | 1.32% |
Construction 1.2%
| Godrej Properties Ltd. | 1.20% |
Fund Manager

Mr. Anuj Kapil
Fund Manager-Equity Scheme
Profile
He has overall experience of 19 years in Managing wealth management and handling Risk Management Process for various Corporates, He worked with Religare Securities Ltd as AVP- Risk & Opreations, FCH Centrum Wealth Managers Ltd. as Manager-Risk and in Priviwealth Pvt Ltd. as Head of Research.
Fund Manager

Mr. Anuj Kapil
Profile
He has overall experience of 19 years in Managing wealth management and handling Risk Management Process for various Corporates, He worked with Religare Securities Ltd as AVP- Risk & Opreations, FCH Centrum Wealth Managers Ltd. as Manager-Risk and in Priviwealth Pvt Ltd. as Head of Research.
Riskometer
Riskometer Scheme#
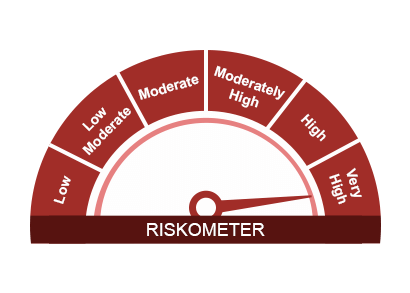
The risk of the scheme is very high risk
Riskometer Scheme Indices
Risk-O-Meter - BSE 500 Shariah TRI
*Investors should consult their financial advisers if in doubt about whether the product is suitable for them.
#Source: ICRA
Fund Details
Nature
Primary investment in listed securities on BSE/NSE which are based on the principles of Shariah after proper fundamental and technical analysis by the Research Team.
Entry load
Nil
Exit Load
Exit Load - 1% if exited on or before 365 days, Nil if exited after 365 days.
Minimum Application Amount
Rs.500/- & multiple of Rs.1/- thereafter
Investment Objective
To provide capital appreciation and income distribution to unitholders through investment in a diversified portfolio of equities, which are based on the principles of Shariah.
Date of Allotment
April 6, 2009
Benchmark
BSE 500 Shariah TRI. Benchmark Index renamed w.e.f. 01/02/2018.
Asset Allocation
Equity & Equity related instruments: 80-100% (*) Surplus money / investible funds available in the scheme at any time will be kept in Current Accounts with banks and will not be invested in any interest b
Monthly AUM
Monthly Average AUM: Rs. 400.62 Cr.
Month End AUM: Rs. 402.37 Cr
Liquidity
Sale & repurchase on all business days.
Net Asset Value (NAV)
Face Value Rs 10/-.
Regular Plan: Rs. 84.19 (IDCW) per unit | Rs. 124.55 (G) per unit| Rs. 124.53 (B) per unit
Direct Plan : Rs. 95.35 (IDCW) per unit | Rs. 142.04 (G) per unit| Rs. 46.55 (B) per unit
NAV Calculation: All Business days.
Base Expense Ratio
Regular Plan : 2.10%
Direct Plan : 0.86%
Quantitative Data
Regular Plan :
Sharpe Ratio: 0.53
Standard Deviation: 15.67%
Beta: 0.97
Portfolio Turnover: 0.77
 One Pager
Nature
Primary investment in listed securities on BSE/NSE which are based on the principles of Shariah after proper fundamental and technical analysis by the Research Team.
Entry load
Nil
Exit Load
Exit Load - 1% if exited on or before 365 days, Nil if exited after 365 days.
Minimum Application Amount
Rs.500/- & multiple of Rs.1/- thereafter
Investment Objective
To provide capital appreciation and income distribution to unitholders through investment in a diversified portfolio of equities, which are based on the principles of Shariah.
Date of Allotment
April 6, 2009
Benchmark
BSE 500 Shariah TRI. Benchmark Index renamed w.e.f. 01/02/2018.
Asset Allocation
Equity & Equity related instruments: 80-100% (*) Surplus money / investible funds available in the scheme at any time will be kept in Current Accounts with banks and will not be invested in any interest b
Monthly AUM
Monthly Average AUM: Rs. 400.62 Cr.
Month End AUM: Rs. 402.37 Cr
Liquidity
Sale & repurchase on all business days.
Net Asset Value (NAV)
Face Value Rs 10/-.
Regular Plan: Rs. 84.19 (IDCW) per unit | Rs. 124.55 (G) per unit| Rs. 124.53 (B) per unit
Direct Plan : Rs. 95.35 (IDCW) per unit | Rs. 142.04 (G) per unit| Rs. 46.55 (B) per unit
NAV Calculation: All Business days.
Base Expense Ratio
Regular Plan : 2.10%
Direct Plan : 0.86%
Quantitative Data
Regular Plan :
Sharpe Ratio: 0.53
Standard Deviation: 15.67%
Beta: 0.97
Portfolio Turnover: 0.77
Inception Date
20 Mar 2009
NAV
-
Fund Type
Equity Schemes
Risk Level
Very High Risk
Who should invest?
- Investors looking for suitable investment opportunities that comply with Shariah norms should look to invest in the Taurus Ethical fund with a Medium to Long term investment horizon. It is a socially responsible form of investing.
- BSE 500 Shariah Index will be used as the benchmark for comparing the performance of this Scheme.
Fund Performance
Return(%) - As on 30th June 2026
| NAV Details (Growth Option) | Regular Plan Growth Option | Scheme Benchmark | Direct Plan Growth Option |
|---|---|---|---|
| 1 Year | (5.20)% | (2.34)% | (3.81)% |
| 3 Year | 11.34% | 10.47% | 12.81% |
| 5 Year | 9.19% | 8.62% | 10.54% |
| Since Inception | 15.66% | Regular : 15.21 | Direct : 14.33% | 14.11% |
Fund’s Portfolio Analysis
As on:
Software 18.42%
| Infosys Ltd. | 5.94% |
| Tata Consultancy Services Ltd. | 4.90% |
| MindTree Ltd. | 1.94% |
| Tata Elxsi Ltd. | 1.64% |
| Cyient Ltd. | 1.23% |
| Larsen & Toubro Infotech Ltd. | 0.66% |
| HCL Technologies Ltd. | 0.60% |
| Coforge Ltd. | 0.51% |
| Oracle Financial Services Software Ltd. | 0.81% |
| Tech Mahindra Ltd. | 0.19% |
Cement 10.09%
| Shree Cement Ltd. | 2.93% |
| The Ramco Cements Ltd. | 2.49% |
| Ultratech Cement Ltd. | 2.23% |
| HeidelbergCement India Ltd. | 1.52% |
| ACC Ltd. | 0.92% |
Consumer Durables 10%
| Voltas Ltd. | 2.51% |
| Cera Sanitaryware Ltd. | 1.77% |
| Bata India Ltd. | 1.53% |
| Relaxo Footwears Ltd. | 1.40% |
| Blue Star Ltd. | 1.82% |
| Havells India Ltd. | 0.97% |
Industrial Products 8.19%
| Cummins India Ltd. | 1.84% |
| Supreme Industries Ltd. | 1.11% |
| SKF India Ltd. | 0.91% |
| Astral Limited | 1.09% |
| Grindwell Norton Ltd. | 0.55% |
| RHI MAGNESITA INDIA | 1.03% |
| AIA Engineering Ltd. | 0.84% |
| HEG Ltd. | 0.82% |
| Carborundum Universal Ltd. | 0.00% |
Pharmaceuticals 7.32%
| Sun Pharmaceutical Industries Ltd. | 1.85% |
| Alkem Laboratories Ltd. | 1.30% |
| Divi's Laboratories Ltd. | 1.27% |
| Cipla Ltd. | 0.86% |
| Aurobindo Pharma Ltd. | 0.87% |
| Cadila Healthcare Ltd. | 0.75% |
| Granules India Ltd. | 0.42% |
Consumer Non Durables 7.37%
| Tata Consumer Products Ltd. | 2.01% |
| Berger Paints India Ltd. | 1.90% |
| Dabur India Ltd. | 1.53% |
| Hindustan Unilever Ltd. | 1.05% |
| Colgate Palmolive (India) Ltd. | 0.88% |
Chemicals 5.89%
| Atul Ltd. | 1.95% |
| Pidilite Industries Ltd. | 1.39% |
| Solar Industries India Ltd. | 1.42% |
| Galaxy Surfactants Ltd. | 1.13% |
Auto 4.61%
| Maruti Suzuki India Ltd. | 2.01% |
| Bajaj Auto Ltd. | 1.15% |
| Eicher Motors Ltd. | 0.91% |
| Hero MotoCorp Ltd. | 0.54% |
Pesticides 5.01%
| Sumitomo Chemical India Ltd. | 2.22% |
| Dhanuka Agritech Ltd. | 1.67% |
| PI Industries Ltd. | 1.12% |
Auto Ancillaries 3.02%
| Bosch Ltd. | 1.81% |
| MRF Ltd. | 1.21% |
Gas 2.57%
| Gujarat Gas Ltd. | 1.17% |
| Petronet LNG Ltd. | 0.79% |
| GAIL (India) Ltd. | 0.61% |
Fertilisers 1.98%
| Coromandel International Ltd. | 1.98% |
Ferrous Metals 1.72%
| Ratnamani Metals & Tubes Ltd. | 1.72% |
Industrial Capital Goods 1.97%
| Thermax Ltd. | 1.97% |
Minerals/Mining 1.55%
| NMDC Ltd. | 1.55% |
Capital Markets 1.32%
| Indian Energy Exchange Ltd. | 1.32% |
Construction 1.2%
| Godrej Properties Ltd. | 1.20% |
Transportation 0.92%
| VRL Logistics Ltd. | 0.92% |
Healthcare Services 0.49%
| Apollo Hospitals Enterprise Ltd. | 0.49% |
Fund Manager
Mr. Anuj Kapil
Fund Manager-Equity Scheme
Profile
He has overall experience of 19 years in Managing wealth management and handling Risk Management Process for various Corporates, He worked with Religare Securities Ltd as AVP- Risk & Opreations, FCH Centrum Wealth Managers Ltd. as Manager-Risk and in Priviwealth Pvt Ltd. as Head of Research.
Fund Manager
Mr. Anuj Kapil
Profile
He has overall experience of 19 years in Managing wealth management and handling Risk Management Process for various Corporates, He worked with Religare Securities Ltd as AVP- Risk & Opreations, FCH Centrum Wealth Managers Ltd. as Manager-Risk and in Priviwealth Pvt Ltd. as Head of Research.
Riskometer
Riskometer Scheme#
The risk of the scheme is very high risk
Riskometer Scheme Indices
Risk-O-Meter - BSE 500 Shariah TRI
*Investors should consult their financial advisers if in doubt about whether the product is suitable for them.
#Source: ICRA
Fund Details
Nature
Primary investment in listed securities on BSE/NSE which are based on the principles of Shariah after proper fundamental and technical analysis by the Research Team.
Entry load
Nil
Exit Load
Exit Load - 1% if exited on or before 365 days, Nil if exited after 365 days.
Minimum Application Amount
Rs.500/- & multiple of Rs.1/- thereafter
Investment Objective
To provide capital appreciation and income distribution to unitholders through investment in a diversified portfolio of equities, which are based on the principles of Shariah.
Date of Allotment
April 6, 2009
Benchmark
BSE 500 Shariah TRI. Benchmark Index renamed w.e.f. 01/02/2018.
Asset Allocation
Equity & Equity related instruments: 80-100% (*) Surplus money / investible funds available in the scheme at any time will be kept in Current Accounts with banks and will not be invested in any interest b
Monthly AUM
Monthly Average AUM: Rs. 400.62 Cr.
Month End AUM: Rs. 402.37 Cr
Liquidity
Sale & repurchase on all business days.
Net Asset Value (NAV)
Face Value Rs 10/-.
Regular Plan: Rs. 84.19 (IDCW) per unit | Rs. 124.55 (G) per unit| Rs. 124.53 (B) per unit
Direct Plan : Rs. 95.35 (IDCW) per unit | Rs. 142.04 (G) per unit| Rs. 46.55 (B) per unit
NAV Calculation: All Business days.
Base Expense Ratio
Regular Plan : 2.10%
Direct Plan : 0.86%
Quantitative Data
Regular Plan :
Sharpe Ratio: 0.53
Standard Deviation: 15.67%
Beta: 0.97
Portfolio Turnover: 0.77
Fund Download File
Nature
Primary investment in listed securities on BSE/NSE which are based on the principles of Shariah after proper fundamental and technical analysis by the Research Team.
Entry load
Nil
Exit Load
Exit Load - 1% if exited on or before 365 days, Nil if exited after 365 days.
Minimum Application Amount
Rs.500/- & multiple of Rs.1/- thereafter
Investment Objective
To provide capital appreciation and income distribution to unitholders through investment in a diversified portfolio of equities, which are based on the principles of Shariah.
Date of Allotment
April 6, 2009
Benchmark
BSE 500 Shariah TRI. Benchmark Index renamed w.e.f. 01/02/2018.
Asset Allocation
Equity & Equity related instruments: 80-100% (*) Surplus money / investible funds available in the scheme at any time will be kept in Current Accounts with banks and will not be invested in any interest b
Monthly AUM
Monthly Average AUM: Rs. 400.62 Cr.
Month End AUM: Rs. 402.37 Cr
Liquidity
Sale & repurchase on all business days.
Net Asset Value (NAV)
Face Value Rs 10/-.
Regular Plan: Rs. 84.19 (IDCW) per unit | Rs. 124.55 (G) per unit| Rs. 124.53 (B) per unit
Direct Plan : Rs. 95.35 (IDCW) per unit | Rs. 142.04 (G) per unit| Rs. 46.55 (B) per unit
NAV Calculation: All Business days.
Base Expense Ratio
Regular Plan : 2.10%
Direct Plan : 0.86%
Quantitative Data
Regular Plan :
Sharpe Ratio: 0.53
Standard Deviation: 15.67%
Beta: 0.97
Portfolio Turnover: 0.77