Inception Date
01 Jan 2013
NAV
-
Fund Type
Equity Schemes
Risk Level
Very High Risk
Who should invest?
- Taurus Flexi Cap Fund is suited for individuals looking at returns and have a long-term investment outlook and a higher tolerance for risk.
Fund Performance
Return(%) - As on 30th June 2026
| NAV Details (Growth Option) | Regular Plan Growth Option | Scheme Benchmark | Direct Plan Growth Option |
|---|---|---|---|
| 1 Year | (2.62)% | (1.96)% | (2.55)% |
| 3 Year | 12.02% | 12.52% | 12.09% |
| 5 Year | 10.22% | 12.20% | 10.28% |
| Since Inception | 10.04% | Regular : -- | Direct : 13.53% | 9.92% |
Fund’s Portfolio Analysis
As on:
Finance 6.32%
| LIC Housing Finance Ltd. | 0.67% |
| Housing Development Finance Corporation Ltd. | 4.49% |
| Mahindra & Mahindra Financial Services Ltd. | 1.16% |
Auto 4.09%
| Maruti Suzuki India Ltd. | 1.34% |
| Bajaj Auto Ltd. | 0.81% |
| Escorts Ltd. | 0.68% |
| Hero MotoCorp Ltd. | 0.63% |
| Tata Motors Ltd. | 0.63% |
Minerals/Mining 2.07%
| NMDC Ltd. | 1.05% |
| MOIL Ltd. | 1.02% |
Retailing 0.84%
| Aditya Birla Fashion and Retail Ltd. | 0.84% |
Capital Markets 5.93%
| Indian Energy Exchange Ltd. | 2.33% |
| Multi Commodity Exchange of India Ltd. | 1.36% |
| ICRA Ltd. | 1.35% |
| Central Depository Services (I) Ltd. | 0.89% |
Auto Ancillaries 0.52%
| CEAT Ltd. | 0.52% |
Banks 20.02%
| ICICI Bank Ltd. | 5.97% |
| HDFC Bank Ltd. | 5.49% |
| State Bank of India | 3.76% |
| Axis Bank Ltd. | 2.48% |
| Kotak Mahindra Bank Ltd. | 1.67% |
| CSB Bank Ltd. | 0.65% |
Consumer Durables 1.81%
| Havells India Ltd. | 0.83% |
| Bata India Ltd. | 0.63% |
| Voltas Ltd. | 0.35% |
Healthcare Services 0.45%
| Dr. Lal Path labs Ltd. | 0.45% |
Petroleum Products 5.66%
| Reliance Industries Ltd. | 4.54% |
| Bharat Petroleum Corporation Ltd. | 1.12% |
Pharmaceuticals 4.02%
| Sun Pharmaceutical Industries Ltd. | 1.48% |
| Cipla Ltd. | 1.23% |
| Aurobindo Pharma Ltd. | 0.83% |
| Granules India Ltd. | 0.48% |
Insurance 1.32%
| HDFC Life Insurance Company Ltd. | 1.32% |
Industrial Capital Goods 1.25%
| GE T&D India Ltd. | 0.64% |
| GE Power India Ltd. | 0.61% |
| Wellwin Industry Ltd. | 0.00% |
Industrial Products 4.77%
| AIA Engineering Ltd. | 1.18% |
| SKF India Ltd. | 0.99% |
| RHI MAGNESITA INDIA | 0.94% |
| Graphite India Ltd. | 0.69% |
| HEG Ltd. | 0.53% |
| Finolex Cables Ltd. | 0.44% |
Software 13.75%
| Infosys Ltd. | 6.80% |
| Tata Consultancy Services Ltd. | 4.61% |
| HCL Technologies Ltd. | 0.76% |
| Oracle Financial Services Software Ltd. | 0.74% |
| Larsen & Toubro Infotech Ltd. | 0.64% |
| Tech Mahindra Ltd. | 0.20% |
Consumer Non Durables 3.98%
| ITC Ltd. | 1.47% |
| Asian Paints Ltd. | 1.46% |
| Hindustan Unilever Ltd. | 1.05% |
Fertilisers 1.24%
| Coromandel International Ltd. | 1.24% |
Construction 1.11%
| PNC Infratech Ltd. | 1.11% |
Power 1.01%
| KEC International Ltd. | 1.01% |
Construction Project 3.25%
| Larsen & Toubro Ltd. | 3.25% |
Pesticides 0.95%
| Rallis India Ltd. | 0.95% |
Cement 4.35%
| Ultratech Cement Ltd. | 2.04% |
| HeidelbergCement India Ltd. | 1.35% |
| ACC Ltd. | 0.96% |
Ferrous Metals 2.83%
| Jindal Steel & Power Ltd. | 1.96% |
| Steel Authority of India Ltd. | 0.87% |
Transportation 0.95%
| VRL Logistics Ltd. | 0.95% |
Chemicals 0.94%
| Galaxy Surfactants Ltd. | 0.94% |
Telecom Services 2.38%
| Bharti Airtel Ltd. | 2.38% |
Non - Ferrous Metals 0.89%
| Hindustan Zinc Ltd. | 0.89% |
Fund Manager

Mr. Anuj Kapil
Fund Manager-Equity Scheme
Profile
He has overall experience of 19 years in Managing wealth management and handling Risk Management Process for various Corporates, He worked with Religare Securities Ltd as AVP- Risk & Opreations, FCH Centrum Wealth Managers Ltd. as Manager-Risk and in Priviwealth Pvt Ltd. as Head of Research.
Fund Manager

Mr. Anuj Kapil
Profile
He has overall experience of 19 years in Managing wealth management and handling Risk Management Process for various Corporates, He worked with Religare Securities Ltd as AVP- Risk & Opreations, FCH Centrum Wealth Managers Ltd. as Manager-Risk and in Priviwealth Pvt Ltd. as Head of Research.
Riskometer
Riskometer Scheme#
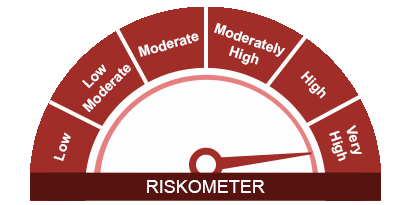
The risk of the scheme is very high risk
Riskometer Scheme Indices
Risk-O-Meter - BSE 500 TRI
*Investors should consult their financial advisers if in doubt about whether the product is suitable for them.
#Source: ICRA
Fund Details
Nature
The scheme is positioned as a multicap fund seeking growth and capital appreciation through investment in equities primarily. The fund will pursue the policy of diversification of its assets and to avoid concentration in a particular industry or group of industries.
Entry load
Nil
Exit Load
1% if exited on or before 365 days, Nil if exited after 365 days.
Minimum Application Amount
Rs.500/- & multiple of Rs.1/- thereafter
Investment Objective
The basic objective of the Scheme is to provide long-term capital appreciation. Emphasis will be on sharing growth through appreciation as well as on the distribution of income by way of dividend.
Date of Allotment
January 29, 1994
Benchmark
BSE 500 TRI. Benchmark Index changed w.e.f. 23/03/2018
Asset Allocation
Equity & Equity related instruments: 65-100%
Debt Securities: 0-35%
Money Market, Cash & other assets : 0-35%
Monthly AUM
Monthly Average AUM: Rs. 345.21 Cr
Month End AUM: Rs. 344.26 Cr
Liquidity
Sale & repurchase on all business days.
Net Asset Value (NAV)
Face Value Rs 10/- .
Regular Plan: Rs.106.31 (IDCW) Rs. 219.08 (G) per unit.
Direct Plan: Rs.115.06 (IDCW), Rs. 228.06 (G) per unit.
NAV Calculation: All Business days.
Base Expense Ratio
Regular Plan : 2.09%
Direct Plan : 2.03%
Quantitative Data
Regular Plan :
Sharpe Ratio: 0.44
Standard Deviation: 16.11%
Beta: 1.01
Portfolio Turnover: 0.86
Fund Download File
 One Pager
Nature
The scheme is positioned as a multicap fund seeking growth and capital appreciation through investment in equities primarily. The fund will pursue the policy of diversification of its assets and to avoid concentration in a particular industry or group of industries.
Entry load
Nil
Exit Load
1% if exited on or before 365 days, Nil if exited after 365 days.
Minimum Application Amount
Rs.500/- & multiple of Rs.1/- thereafter
Investment Objective
The basic objective of the Scheme is to provide long-term capital appreciation. Emphasis will be on sharing growth through appreciation as well as on the distribution of income by way of dividend.
Date of Allotment
January 29, 1994
Benchmark
BSE 500 TRI. Benchmark Index changed w.e.f. 23/03/2018
Asset Allocation
Equity & Equity related instruments: 65-100%
Debt Securities: 0-35%
Money Market, Cash & other assets : 0-35%
Monthly AUM
Monthly Average AUM: Rs. 345.21 Cr
Month End AUM: Rs. 344.26 Cr
Liquidity
Sale & repurchase on all business days.
Net Asset Value (NAV)
Face Value Rs 10/- .
Regular Plan: Rs.106.31 (IDCW) Rs. 219.08 (G) per unit.
Direct Plan: Rs.115.06 (IDCW), Rs. 228.06 (G) per unit.
NAV Calculation: All Business days.
Base Expense Ratio
Regular Plan : 2.09%
Direct Plan : 2.03%
Quantitative Data
Regular Plan :
Sharpe Ratio: 0.44
Standard Deviation: 16.11%
Beta: 1.01
Portfolio Turnover: 0.86
Fund Download File
Inception Date
29 Jan 1994
NAV
-
Fund Type
Equity Schemes
Risk Level
Very High Risk
Who should invest?
- Taurus Flexi Cap Fund is suited for individuals looking at returns and have a long-term investment outlook and a higher tolerance for risk.
Fund Performance
Return(%) - As on 30th June 2026
| NAV Details (Growth Option) | Regular Plan Growth Option | Scheme Benchmark | Direct Plan Growth Option |
|---|---|---|---|
| 1 Year | (2.62)% | (1.96)% | (2.55)% |
| 3 Year | 12.02% | 12.52% | 12.09% |
| 5 Year | 10.22% | 12.20% | 10.28% |
| Since Inception | 10.04% | Regular : -- | Direct : 13.53% | 9.92% |
Fund’s Portfolio Analysis
As on:
Banks 20.02%
| ICICI Bank Ltd. | 5.97% |
| HDFC Bank Ltd. | 5.49% |
| State Bank of India | 3.76% |
| Axis Bank Ltd. | 2.48% |
| Kotak Mahindra Bank Ltd. | 1.67% |
| CSB Bank Ltd. | 0.65% |
Software 13.75%
| Infosys Ltd. | 6.80% |
| Tata Consultancy Services Ltd. | 4.61% |
| HCL Technologies Ltd. | 0.76% |
| Oracle Financial Services Software Ltd. | 0.74% |
| Larsen & Toubro Infotech Ltd. | 0.64% |
| Tech Mahindra Ltd. | 0.20% |
Finance 6.32%
| Housing Development Finance Corporation Ltd. | 4.49% |
| Mahindra & Mahindra Financial Services Ltd. | 1.16% |
| LIC Housing Finance Ltd. | 0.67% |
Capital Markets 5.93%
| Indian Energy Exchange Ltd. | 2.33% |
| Multi Commodity Exchange of India Ltd. | 1.36% |
| ICRA Ltd. | 1.35% |
| Central Depository Services (I) Ltd. | 0.89% |
Petroleum Products 5.66%
| Reliance Industries Ltd. | 4.54% |
| Bharat Petroleum Corporation Ltd. | 1.12% |
Industrial Products 4.77%
| AIA Engineering Ltd. | 1.18% |
| SKF India Ltd. | 0.99% |
| RHI MAGNESITA INDIA | 0.94% |
| Graphite India Ltd. | 0.69% |
| HEG Ltd. | 0.53% |
| Finolex Cables Ltd. | 0.44% |
Cement 4.35%
| Ultratech Cement Ltd. | 2.04% |
| HeidelbergCement India Ltd. | 1.35% |
| ACC Ltd. | 0.96% |
Auto 4.09%
| Maruti Suzuki India Ltd. | 1.34% |
| Bajaj Auto Ltd. | 0.81% |
| Escorts Ltd. | 0.68% |
| Hero MotoCorp Ltd. | 0.63% |
| Tata Motors Ltd. | 0.63% |
Pharmaceuticals 4.02%
| Sun Pharmaceutical Industries Ltd. | 1.48% |
| Cipla Ltd. | 1.23% |
| Aurobindo Pharma Ltd. | 0.83% |
| Granules India Ltd. | 0.48% |
Consumer Non Durables 3.98%
| ITC Ltd. | 1.47% |
| Asian Paints Ltd. | 1.46% |
| Hindustan Unilever Ltd. | 1.05% |
Construction Project 3.25%
| Larsen & Toubro Ltd. | 3.25% |
Ferrous Metals 2.83%
| Jindal Steel & Power Ltd. | 1.96% |
| Steel Authority of India Ltd. | 0.87% |
Telecom Services 2.38%
| Bharti Airtel Ltd. | 2.38% |
Minerals/Mining 2.07%
| NMDC Ltd. | 1.05% |
| MOIL Ltd. | 1.02% |
Consumer Durables 1.81%
| Havells India Ltd. | 0.83% |
| Bata India Ltd. | 0.63% |
| Voltas Ltd. | 0.35% |
Insurance 1.32%
| HDFC Life Insurance Company Ltd. | 1.32% |
Industrial Capital Goods 1.25%
| GE T&D India Ltd. | 0.64% |
| GE Power India Ltd. | 0.61% |
| Wellwin Industry Ltd. | 0.00% |
Fertilisers 1.24%
| Coromandel International Ltd. | 1.24% |
Construction 1.11%
| PNC Infratech Ltd. | 1.11% |
Power 1.01%
| KEC International Ltd. | 1.01% |
Pesticides 0.95%
| Rallis India Ltd. | 0.95% |
Transportation 0.95%
| VRL Logistics Ltd. | 0.95% |
Chemicals 0.94%
| Galaxy Surfactants Ltd. | 0.94% |
Non - Ferrous Metals 0.89%
| Hindustan Zinc Ltd. | 0.89% |
Retailing 0.84%
| Aditya Birla Fashion and Retail Ltd. | 0.84% |
Auto Ancillaries 0.52%
| CEAT Ltd. | 0.52% |
Healthcare Services 0.45%
| Dr. Lal Path labs Ltd. | 0.45% |
Fund Manager
Mr. Anuj Kapil
Fund Manager-Equity Scheme
Profile
He has overall experience of 19 years in Managing wealth management and handling Risk Management Process for various Corporates, He worked with Religare Securities Ltd as AVP- Risk & Opreations, FCH Centrum Wealth Managers Ltd. as Manager-Risk and in Priviwealth Pvt Ltd. as Head of Research.
Fund Manager
Mr. Anuj Kapil
Profile
He has overall experience of 19 years in Managing wealth management and handling Risk Management Process for various Corporates, He worked with Religare Securities Ltd as AVP- Risk & Opreations, FCH Centrum Wealth Managers Ltd. as Manager-Risk and in Priviwealth Pvt Ltd. as Head of Research.
Riskometer
Riskometer Scheme#
The risk of the scheme is very high risk
Riskometer Scheme Indices
Risk-O-Meter - BSE 500 TRI
*Investors should consult their financial advisers if in doubt about whether the product is suitable for them.
#Source: ICRA
Fund Details
Nature
The scheme is positioned as a multicap fund seeking growth and capital appreciation through investment in equities primarily. The fund will pursue the policy of diversification of its assets and to avoid concentration in a particular industry or group of industries.
Entry load
Nil
Exit Load
1% if exited on or before 365 days, Nil if exited after 365 days.
Minimum Application Amount
Rs.500/- & multiple of Rs.1/- thereafter
Investment Objective
The basic objective of the Scheme is to provide long-term capital appreciation. Emphasis will be on sharing growth through appreciation as well as on the distribution of income by way of dividend.
Date of Allotment
January 29, 1994
Benchmark
BSE 500 TRI. Benchmark Index changed w.e.f. 23/03/2018
Asset Allocation
Equity & Equity related instruments: 65-100%
Debt Securities: 0-35%
Money Market, Cash & other assets : 0-35%
Monthly AUM
Monthly Average AUM: Rs. 345.21 Cr
Month End AUM: Rs. 344.26 Cr
Liquidity
Sale & repurchase on all business days.
Net Asset Value (NAV)
Face Value Rs 10/- .
Regular Plan: Rs.106.31 (IDCW) Rs. 219.08 (G) per unit.
Direct Plan: Rs.115.06 (IDCW), Rs. 228.06 (G) per unit.
NAV Calculation: All Business days.
Base Expense Ratio
Regular Plan : 2.09%
Direct Plan : 2.03%
Quantitative Data
Regular Plan :
Sharpe Ratio: 0.44
Standard Deviation: 16.11%
Beta: 1.01
Portfolio Turnover: 0.86
Fund Download File
Nature
The scheme is positioned as a multicap fund seeking growth and capital appreciation through investment in equities primarily. The fund will pursue the policy of diversification of its assets and to avoid concentration in a particular industry or group of industries.
Entry load
Nil
Exit Load
1% if exited on or before 365 days, Nil if exited after 365 days.
Minimum Application Amount
Rs.500/- & multiple of Rs.1/- thereafter
Investment Objective
The basic objective of the Scheme is to provide long-term capital appreciation. Emphasis will be on sharing growth through appreciation as well as on the distribution of income by way of dividend.
Date of Allotment
January 29, 1994
Benchmark
BSE 500 TRI. Benchmark Index changed w.e.f. 23/03/2018
Asset Allocation
Equity & Equity related instruments: 65-100%
Debt Securities: 0-35%
Money Market, Cash & other assets : 0-35%
Monthly AUM
Monthly Average AUM: Rs. 345.21 Cr
Month End AUM: Rs. 344.26 Cr
Liquidity
Sale & repurchase on all business days.
Net Asset Value (NAV)
Face Value Rs 10/- .
Regular Plan: Rs.106.31 (IDCW) Rs. 219.08 (G) per unit.
Direct Plan: Rs.115.06 (IDCW), Rs. 228.06 (G) per unit.
NAV Calculation: All Business days.
Base Expense Ratio
Regular Plan : 2.09%
Direct Plan : 2.03%
Quantitative Data
Regular Plan :
Sharpe Ratio: 0.44
Standard Deviation: 16.11%
Beta: 1.01
Portfolio Turnover: 0.86