Inception Date
01 Jan 2013
NAV
-
Fund Type
Equity Schemes
Risk Level
Very High Risk
Who should invest?
- Taurus Mid Cap Fund is suited for individuals looking at better than average returns in the long-term investment outlook and a higher tolerance for risk.
Fund Performance
Return(%) - As on 30th June 2026
| NAV Details (Growth Option) | Regular Plan Growth Option | Scheme Benchmark | Direct Plan Growth Option |
|---|---|---|---|
| 1 Year | (6.09)% | 4.22% | (5.65)% |
| 3 Year | 10.37% | 20.03% | 10.83% |
| 5 Year | 11.25% | 18.28% | 11.68% |
| Since Inception | 8.03% | Regular : -- | Direct : 18.20% | 15.47% |
Fund’s Portfolio Analysis
As on:
Finance 11.93%
| Aditya Birla Capital Ltd. | 1.13% |
| LIC Housing Finance Ltd. | 0.83% |
| Shriram Transport Finance Company Ltd. | 1.09% |
| Muthoot Finance Ltd. | 0.42% |
| Sundaram Finance Ltd. | 2.46% |
| Cholamandalam Investment & Finance Co. Ltd. | 1.92% |
| Mahindra & Mahindra Financial Services Ltd. | 2.02% |
| Manappuram Finance Ltd. | 2.06% |
Banks 6.33%
| The Federal Bank Ltd. | 2.45% |
| RBL Bank Ltd. | 1.83% |
| City Union Bank Ltd. | 2.05% |
Retailing 3.59%
| Trent Ltd. | 0.84% |
| Aditya Birla Fashion and Retail Ltd. | 2.75% |
Auto Ancillaries 1.49%
| Exide Industries Ltd. | 0.67% |
| Bosch Ltd. | 0.82% |
Consumer Durables 3.06%
| Voltas Ltd. | 2.36% |
| Havells India Ltd. | 0.70% |
Non - Ferrous Metals 0.83%
| Hindustan Zinc Ltd. | 0.83% |
Industrial Products 11.87%
| Supreme Industries Ltd. | 2.77% |
| Astral Limited | 2.14% |
| SKF India Ltd. | 1.40% |
| AIA Engineering Ltd. | 1.59% |
| Orient Refractories Ltd. | 0.79% |
| Finolex Cables Ltd. | 0.43% |
| Graphite India Ltd. | 0.56% |
| RHI MAGNESITA INDIA | 0.88% |
| Grindwell Norton Ltd. | 0.48% |
| Carborundum Universal Ltd. | 0.44% |
| HEG Ltd. | 0.39% |
Gas 4.03%
| Gujarat State Petronet Ltd. | 2.22% |
| Gujarat Gas Ltd. | 1.81% |
Healthcare Services 0.84%
| Apollo Hospitals Enterprise Ltd. | 0.84% |
Pharmaceuticals 2.64%
| Alembic Pharmaceuticals Ltd. | 1.08% |
| Granules India Ltd. | 0.78% |
| Aurobindo Pharma Ltd. | 0.78% |
Oil 0.68%
| Oil India Ltd. | 0.68% |
Chemicals 11.77%
| Atul Ltd. | 2.97% |
| Galaxy Surfactants Ltd. | 2.56% |
| Tata Chemicals Ltd. | 3.11% |
| Solar Industries India Ltd. | 1.94% |
| SRF Ltd. | 1.19% |
Ferrous Metals 4.7%
| Jindal Steel & Power Ltd. | 2.70% |
| Ratnamani Metals & Tubes Ltd. | 1.15% |
| Steel Authority of India Ltd. | 0.85% |
Auto 1.1%
| Escorts Ltd. | 1.10% |
Construction Project 0.57%
| NCC Ltd. | 0.57% |
Cement 3.86%
| The Ramco Cements Ltd. | 2.82% |
| HeidelbergCement India Ltd. | 1.04% |
Consumer Non Durables 2.83%
| Tata Consumer Products Ltd. | 1.55% |
| Godrej Industries Ltd. | 1.28% |
Transportation 0.94%
| VRL Logistics Ltd. | 0.94% |
Power 0.5%
| Kalpataru Power Transmission Ltd. | 0.50% |
Industrial Capital Goods 2.86%
| Honeywell Automation India Ltd. | 1.64% |
| GE Power India Ltd. | 0.60% |
| GE T&D India Ltd. | 0.62% |
Fertilisers 2.52%
| Coromandel International Ltd. | 2.52% |
Software 8.65%
| MindTree Ltd. | 2.41% |
| Oracle Financial Services Software Ltd. | 0.73% |
| Mphasis Ltd. | 2.24% |
| Cyient Ltd. | 1.03% |
| Coforge Ltd. | 0.92% |
| Larsen & Toubro Infotech Ltd. | 0.62% |
| Tata Elxsi Ltd. | 0.70% |
Capital Markets 2.27%
| Central Depository Services (I) Ltd. | 1.04% |
| Indian Energy Exchange Ltd. | 1.23% |
Pesticides 4.8%
| Sumitomo Chemical India Ltd. | 1.06% |
| PI Industries Ltd. | 2.39% |
| Dhanuka Agritech Ltd. | 0.54% |
| Rallis India Ltd. | 0.81% |
Construction 2.73%
| Godrej Properties Ltd. | 1.67% |
| PNC Infratech Ltd. | 0.80% |
| Capacit'e Infraprojects Ltd. | 0.26% |
Minerals/Mining 3.27%
| NMDC Ltd. | 2.37% |
| MOIL Ltd. | 0.90% |
Leisure Services 0.62%
| Jubilant Foodworks Ltd. | 0.62% |
Fund Manager

Mr. Anuj Kapil
Fund Manager-Equity Scheme
Profile
He has overall experience of 19 years in Managing wealth management and handling Risk Management Process for various Corporates, He worked with Religare Securities Ltd as AVP- Risk & Opreations, FCH Centrum Wealth Managers Ltd. as Manager-Risk and in Priviwealth Pvt Ltd. as Head of Research.
Fund Manager

Mr. Anuj Kapil
Profile
He has overall experience of 19 years in Managing wealth management and handling Risk Management Process for various Corporates, He worked with Religare Securities Ltd as AVP- Risk & Opreations, FCH Centrum Wealth Managers Ltd. as Manager-Risk and in Priviwealth Pvt Ltd. as Head of Research.
Riskometer
Riskometer Scheme#
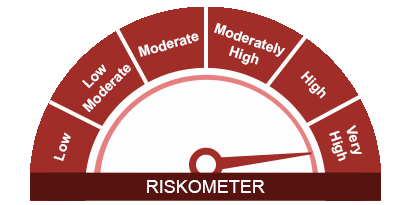
The risk of the scheme is very high risk
Riskometer Scheme Indices
Risk-O-Meter - Taurus Mid Cap Fund - (Indices) - Nifty Midcap 150 TRI
*Investors should consult their financial advisers if in doubt about whether the product is suitable for them.
#Source: ICRA
Fund Details
Nature
Investment in equities will be made through secondary and primary markets predominantly in stocks of midcap companies (as defined by SEBI).
Entry Load
Nil
Exit Load
1% if exited on or before 365 days, Nil if exited after 365 days.
Minimum Application Amount
Rs.500/- & multiple of Rs.1/- thereafter
Investment Objective
The prime objective of the Scheme is to achieve long term capital appreciation by investing in a portfolio consisting of equity and equity related securities predominantly of mid cap companies.
Date of Allotment
September 5, 1994
Benchmark
Nifty Midcap 150 TRI. Benchmark Index changed w.e.f. 01/12/2021
Asset Allocation
Equity & Equity related securities-Midcap companies: 65-100%
Equity & Equity related securities-Other companies: 0-35%
Debt, Cash & Money Market securities: 0-35%
Monthly AUM
Monthly Average AUM: Rs. 125.05 Cr.
Month End AUM: Rs. 124.78 Cr
Liquidity
Sale & repurchase on all business days.
Net Asset Value (NAV)
Face Value Rs 10/-.
Regular Plan: Rs. 104.11 (IDCW), Rs. 116.79 (G) per unit.
Direct Plan: Rs. 109.97 (IDCW), Rs. 123.79 (G) per unit.
NAV Calculation: All Business days.
Base Expense Ratio
Regular Plan : 2.09%
Direct Plan : 1.69%
Quantitative Data
Regular Plan :
Sharpe Ratio: 0.41
Standard Deviation: 18.58%
Beta: 0.98
Portfolio Turnover: 0.78
Fund Download File
 One Pager
Nature
Investment in equities will be made through secondary and primary markets predominantly in stocks of midcap companies (as defined by SEBI).
Entry Load
Nil
Exit Load
1% if exited on or before 365 days, Nil if exited after 365 days.
Minimum Application Amount
Rs.500/- & multiple of Rs.1/- thereafter
Investment Objective
The prime objective of the Scheme is to achieve long term capital appreciation by investing in a portfolio consisting of equity and equity related securities predominantly of mid cap companies.
Date of Allotment
September 5, 1994
Benchmark
Nifty Midcap 150 TRI. Benchmark Index changed w.e.f. 01/12/2021
Asset Allocation
Equity & Equity related securities-Midcap companies: 65-100%
Equity & Equity related securities-Other companies: 0-35%
Debt, Cash & Money Market securities: 0-35%
Monthly AUM
Monthly Average AUM: Rs. 125.05 Cr.
Month End AUM: Rs. 124.78 Cr
Liquidity
Sale & repurchase on all business days.
Net Asset Value (NAV)
Face Value Rs 10/-.
Regular Plan: Rs. 104.11 (IDCW), Rs. 116.79 (G) per unit.
Direct Plan: Rs. 109.97 (IDCW), Rs. 123.79 (G) per unit.
NAV Calculation: All Business days.
Base Expense Ratio
Regular Plan : 2.09%
Direct Plan : 1.69%
Quantitative Data
Regular Plan :
Sharpe Ratio: 0.41
Standard Deviation: 18.58%
Beta: 0.98
Portfolio Turnover: 0.78
Fund Download File
Inception Date
05 Sep 1994
NAV
-
Fund Type
Equity Schemes
Risk Level
Very High Risk
Who should invest?
- Taurus Mid Cap Fund is suited for individuals looking at better than average returns in the long-term investment outlook and a higher tolerance for risk.
Fund Performance
Return(%) - As on 30th June 2026
| NAV Details (Growth Option) | Regular Plan Growth Option | Scheme Benchmark | Direct Plan Growth Option |
|---|---|---|---|
| 1 Year | (6.09)% | 4.22% | (5.65)% |
| 3 Year | 10.37% | 20.03% | 10.83% |
| 5 Year | 11.25% | 18.28% | 11.68% |
| Since Inception | 8.03% | Regular : -- | Direct : 18.20% | 15.47% |
Fund’s Portfolio Analysis
As on:
Industrial Products 11.87%
| Supreme Industries Ltd. | 2.77% |
| Astral Limited | 2.14% |
| SKF India Ltd. | 1.40% |
| AIA Engineering Ltd. | 1.59% |
| Orient Refractories Ltd. | 0.79% |
| Finolex Cables Ltd. | 0.43% |
| Graphite India Ltd. | 0.56% |
| Grindwell Norton Ltd. | 0.48% |
| Carborundum Universal Ltd. | 0.44% |
| HEG Ltd. | 0.39% |
| RHI MAGNESITA INDIA | 0.88% |
Finance 11.93%
| Sundaram Finance Ltd. | 2.46% |
| Cholamandalam Investment & Finance Co. Ltd. | 1.92% |
| Mahindra & Mahindra Financial Services Ltd. | 2.02% |
| Manappuram Finance Ltd. | 2.06% |
| Aditya Birla Capital Ltd. | 1.13% |
| LIC Housing Finance Ltd. | 0.83% |
| Shriram Transport Finance Company Ltd. | 1.09% |
| Muthoot Finance Ltd. | 0.42% |
Chemicals 11.77%
| Atul Ltd. | 2.97% |
| Galaxy Surfactants Ltd. | 2.56% |
| Tata Chemicals Ltd. | 3.11% |
| Solar Industries India Ltd. | 1.94% |
| SRF Ltd. | 1.19% |
Software 8.65%
| MindTree Ltd. | 2.41% |
| Mphasis Ltd. | 2.24% |
| Cyient Ltd. | 1.03% |
| Coforge Ltd. | 0.92% |
| Larsen & Toubro Infotech Ltd. | 0.62% |
| Tata Elxsi Ltd. | 0.70% |
| Oracle Financial Services Software Ltd. | 0.73% |
Banks 6.23%
| City Union Bank Ltd. | 2.35% |
| The Federal Bank Ltd. | 2.05% |
| RBL Bank Ltd. | 1.83% |
Gas 4.03%
| Gujarat State Petronet Ltd. | 2.22% |
| Gujarat Gas Ltd. | 1.81% |
Ferrous Metals 4.7%
| Jindal Steel & Power Ltd. | 2.70% |
| Ratnamani Metals & Tubes Ltd. | 1.15% |
| Steel Authority of India Ltd. | 0.85% |
Cement 3.86%
| The Ramco Cements Ltd. | 2.82% |
| HeidelbergCement India Ltd. | 1.04% |
Industrial Capital Goods 2.86%
| Honeywell Automation India Ltd. | 1.64% |
| GE Power India Ltd. | 0.60% |
| GE T&D India Ltd. | 0.62% |
Pesticides 4.8%
| PI Industries Ltd. | 2.39% |
| Rallis India Ltd. | 0.81% |
| Sumitomo Chemical India Ltd. | 1.06% |
| Dhanuka Agritech Ltd. | 0.54% |
Minerals/Mining 3.27%
| NMDC Ltd. | 2.37% |
| MOIL Ltd. | 0.90% |
Retailing 3.59%
| Aditya Birla Fashion and Retail Ltd. | 2.75% |
| Trent Ltd | 0.84% |
Consumer Durables 3.06%
| Voltas Ltd. | 2.36% |
| Havells India Ltd. | 0.70% |
Pharmaceuticals 2.64%
| Alembic Pharmaceuticals Ltd. | 1.08% |
| Granules India Ltd. | 0.78% |
| Aurobindo Pharma Ltd. | 0.78% |
Consumer Non Durables 2.83%
| Tata Consumer Products Ltd. | 1.55% |
| Godrej Industries Ltd. | 1.28% |
Fertilisers 2.52%
| Coromandel International Ltd. | 2.52% |
Capital Markets 2.27%
| Central Depository Services (I) Ltd. | 1.04% |
| Indian Energy Exchange Ltd. | 1.23% |
Construction 2.73%
| Godrej Properties Ltd. | 1.67% |
| PNC Infratech Ltd. | 0.80% |
| Capacit'e Infraprojects Ltd. | 0.26% |
Leisure Services 0.62%
| Jubilant Foodworks Ltd. | 0.62% |
Auto Ancillaries 1.49%
| Bosch Ltd. | 0.82% |
| Exide Industries Ltd. | 0.67% |
Non - Ferrous Metals 0.83%
| Hindustan Zinc Ltd. | 0.83% |
Healthcare Services 0.84%
| Apollo Hospitals Enterprise Ltd. | 0.84% |
Oil 0.68%
| Oil India Ltd. | 0.68% |
Auto 1.1%
| Escorts Ltd. | 1.10% |
Construction Project 0.57%
| NCC Ltd. | 0.57% |
Transportation 0.94%
| VRL Logistics Ltd. | 0.94% |
Power 0.5%
| Kalpataru Power Transmission Ltd. | 0.50% |
Fund Manager
Mr. Anuj Kapil
Fund Manager-Equity Scheme
Profile
He has overall experience of 19 years in Managing wealth management and handling Risk Management Process for various Corporates, He worked with Religare Securities Ltd as AVP- Risk & Opreations, FCH Centrum Wealth Managers Ltd. as Manager-Risk and in Priviwealth Pvt Ltd. as Head of Research.
Fund Manager
Mr. Anuj Kapil
Profile
He has overall experience of 19 years in Managing wealth management and handling Risk Management Process for various Corporates, He worked with Religare Securities Ltd as AVP- Risk & Opreations, FCH Centrum Wealth Managers Ltd. as Manager-Risk and in Priviwealth Pvt Ltd. as Head of Research.
Riskometer
Riskometer Scheme#
The risk of the scheme is very high risk
Riskometer Scheme Indices
Risk-O-Meter - Taurus Mid Cap Fund - (Indices) - Nifty Midcap 150 TRI
*Investors should consult their financial advisers if in doubt about whether the product is suitable for them.
#Source: ICRA
Fund Details
Nature
Investment in equities will be made through secondary and primary markets predominantly in stocks of midcap companies (as defined by SEBI).
Entry Load
Nil
Exit Load
1% if exited on or before 365 days, Nil if exited after 365 days.
Minimum Application Amount
Rs.500/- & multiple of Rs.1/- thereafter
Investment Objective
The prime objective of the Scheme is to achieve long term capital appreciation by investing in a portfolio consisting of equity and equity related securities predominantly of mid cap companies.
Date of Allotment
September 5, 1994
Benchmark
Nifty Midcap 150 TRI. Benchmark Index changed w.e.f. 01/12/2021
Asset Allocation
Equity & Equity related securities-Midcap companies: 65-100%
Equity & Equity related securities-Other companies: 0-35%
Debt, Cash & Money Market securities: 0-35%
Monthly AUM
Monthly Average AUM: Rs. 125.05 Cr.
Month End AUM: Rs. 124.78 Cr
Liquidity
Sale & repurchase on all business days.
Net Asset Value (NAV)
Face Value Rs 10/-.
Regular Plan: Rs. 104.11 (IDCW), Rs. 116.79 (G) per unit.
Direct Plan: Rs. 109.97 (IDCW), Rs. 123.79 (G) per unit.
NAV Calculation: All Business days.
Base Expense Ratio
Regular Plan : 2.09%
Direct Plan : 1.69%
Quantitative Data
Regular Plan :
Sharpe Ratio: 0.41
Standard Deviation: 18.58%
Beta: 0.98
Portfolio Turnover: 0.78
Fund Download File
Nature
Investment in equities will be made through secondary and primary markets predominantly in stocks of midcap companies (as defined by SEBI).
Entry Load
Nil
Exit Load
1% if exited on or before 365 days, Nil if exited after 365 days.
Minimum Application Amount
Rs.500/- & multiple of Rs.1/- thereafter
Investment Objective
The prime objective of the Scheme is to achieve long term capital appreciation by investing in a portfolio consisting of equity and equity related securities predominantly of mid cap companies.
Date of Allotment
September 5, 1994
Benchmark
Nifty Midcap 150 TRI. Benchmark Index changed w.e.f. 01/12/2021
Asset Allocation
Equity & Equity related securities-Midcap companies: 65-100%
Equity & Equity related securities-Other companies: 0-35%
Debt, Cash & Money Market securities: 0-35%
Monthly AUM
Monthly Average AUM: Rs. 125.05 Cr.
Month End AUM: Rs. 124.78 Cr
Liquidity
Sale & repurchase on all business days.
Net Asset Value (NAV)
Face Value Rs 10/-.
Regular Plan: Rs. 104.11 (IDCW), Rs. 116.79 (G) per unit.
Direct Plan: Rs. 109.97 (IDCW), Rs. 123.79 (G) per unit.
NAV Calculation: All Business days.
Base Expense Ratio
Regular Plan : 2.09%
Direct Plan : 1.69%
Quantitative Data
Regular Plan :
Sharpe Ratio: 0.41
Standard Deviation: 18.58%
Beta: 0.98
Portfolio Turnover: 0.78